
Portfolio Risk Software That Spots What Spreadsheets Miss
Upload holdings and see concentration by sector, geography, and asset class. Monitor drift and run scenario analysis. No spreadsheets.

Trusted by advisory firms across North America















Hidden Concentration Erodes Client Trust
Most concentration issues surface during quarterly reviews, weeks after they became actionable
A portfolio spread across 50 holdings looks diversified, until 40% turns out to be concentrated in tech, hidden across multiple funds. The sector drops and the client calls panicking.
Downloading holdings, categorizing securities, calculating overlaps manually. Every quarterly review means hours per client. That doesn't scale to 100 clients.
Markets drop and clients call. Without scenario data (how the portfolio would have performed in 2008 or COVID), the answer is a guess. Clients notice.
How Portfolio Risk Software Catches What Spreadsheets Miss
See exactly how advisors spot hidden concentration, document it, and prevent client panic calls
See Through Fund Holdings to True Exposure
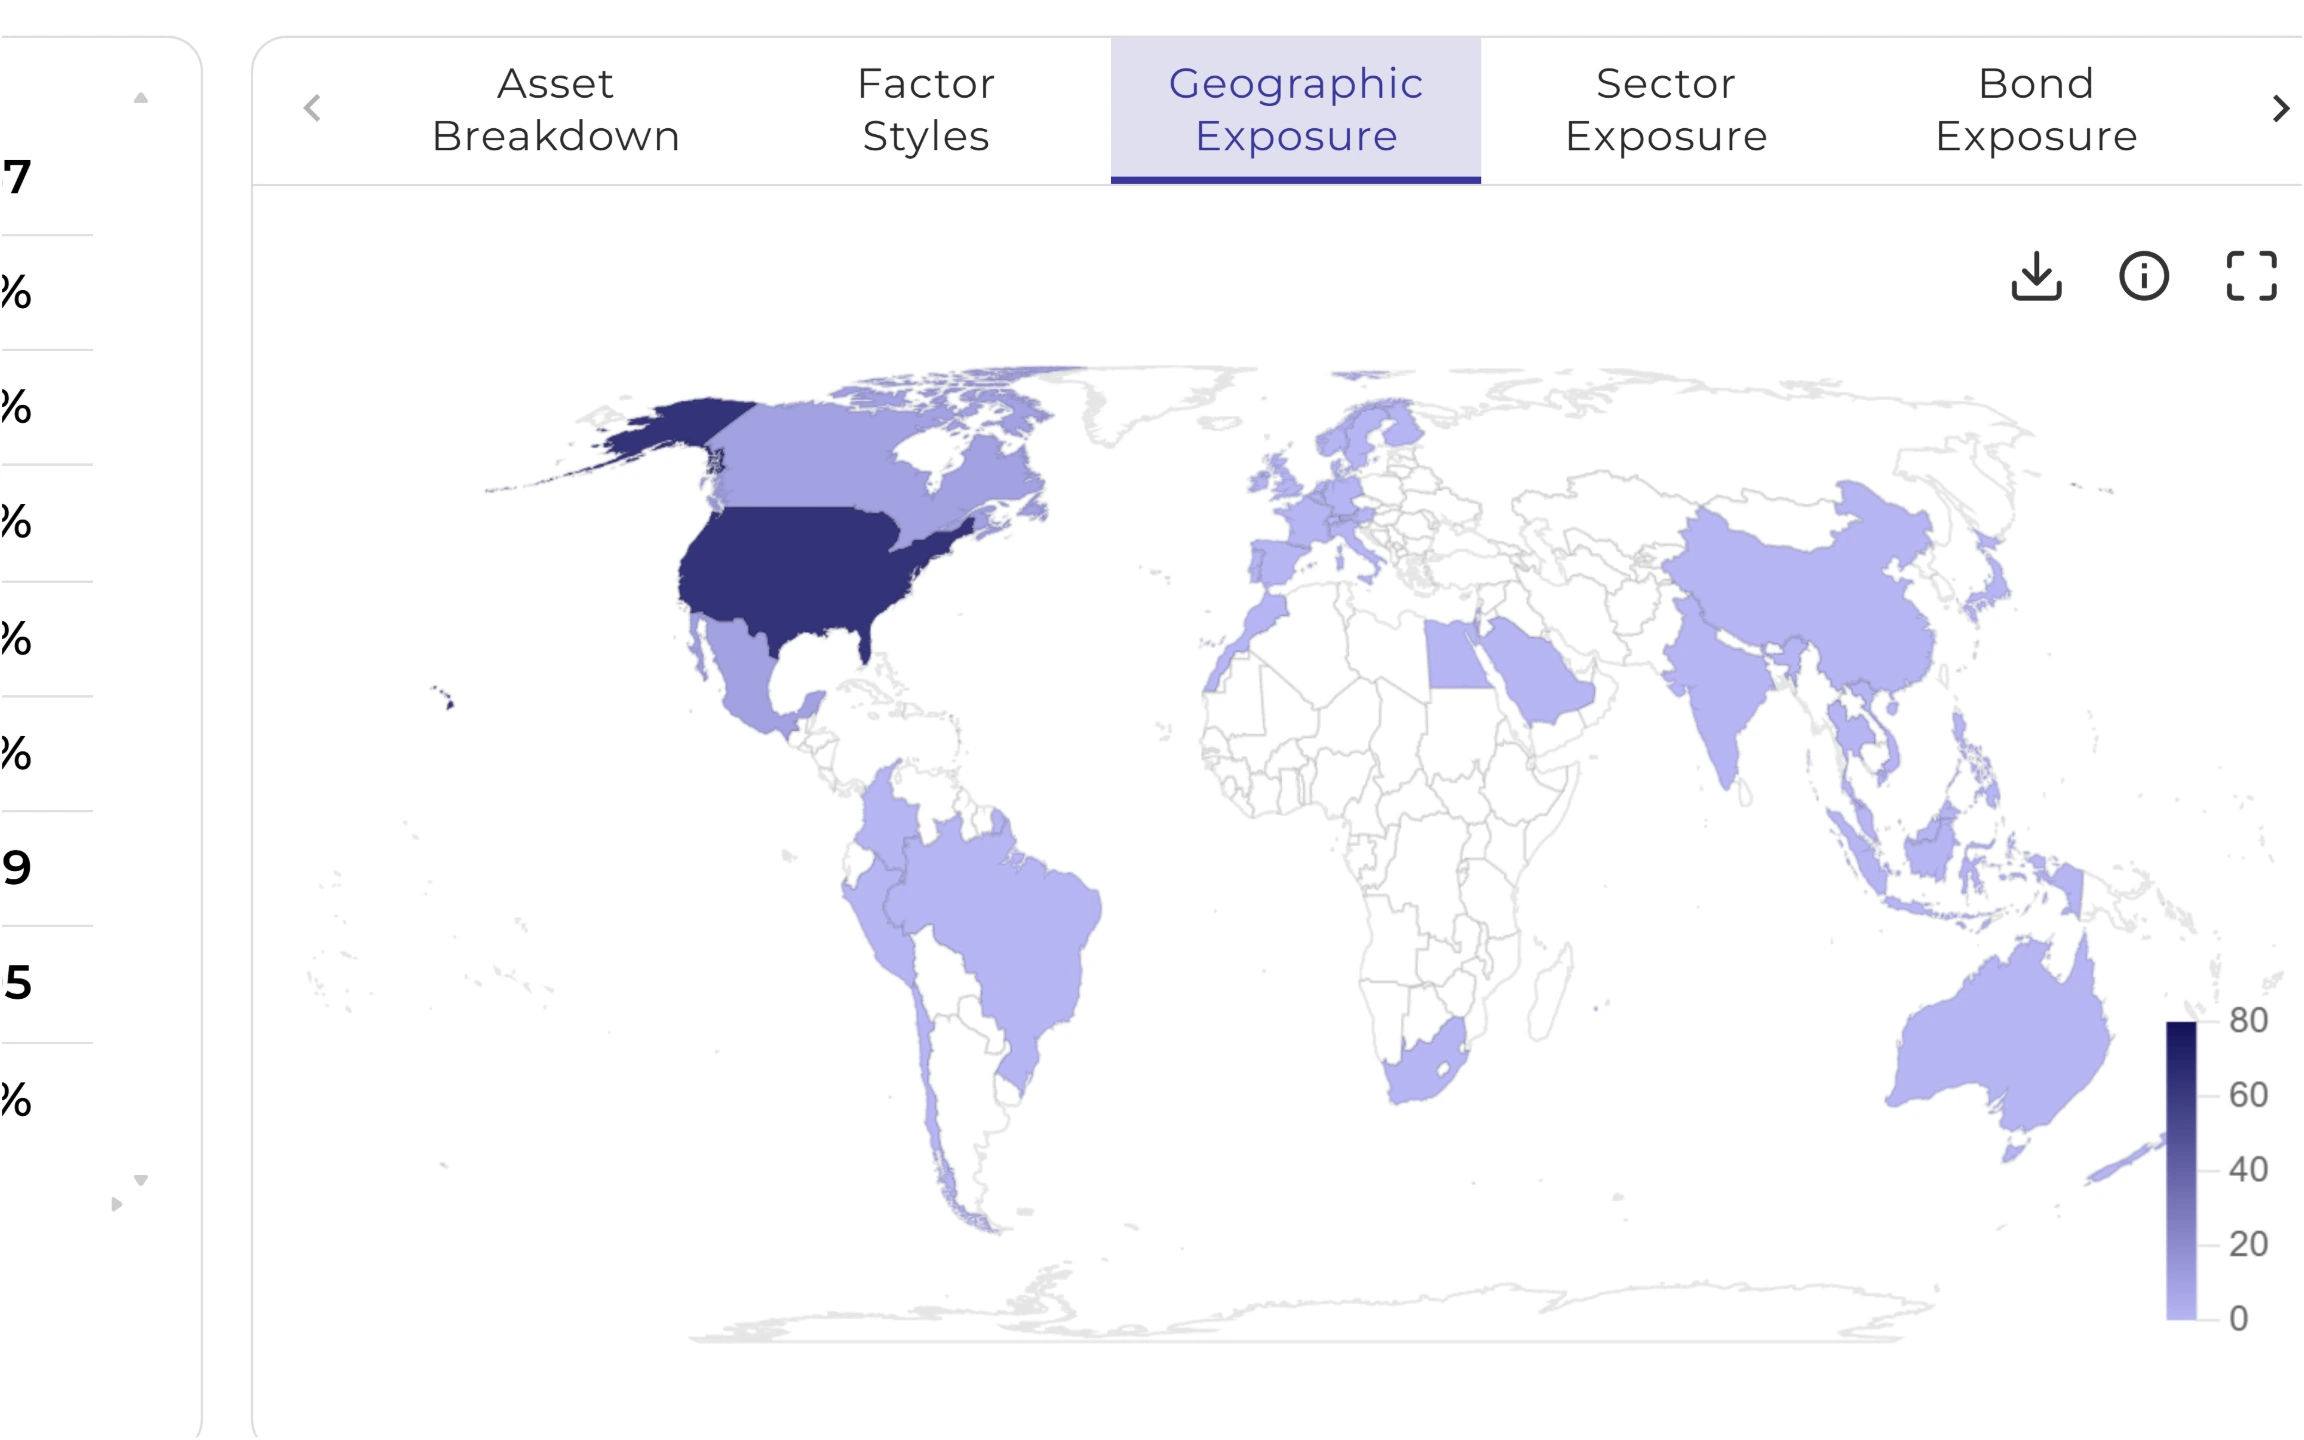
Look through fund holdings to reveal underlying exposure, not just surface-level fund names. See concentration by sector, geography, asset class, and individual securities, updated as the portfolio changes.
Show Clients Exactly Where Risk Lives
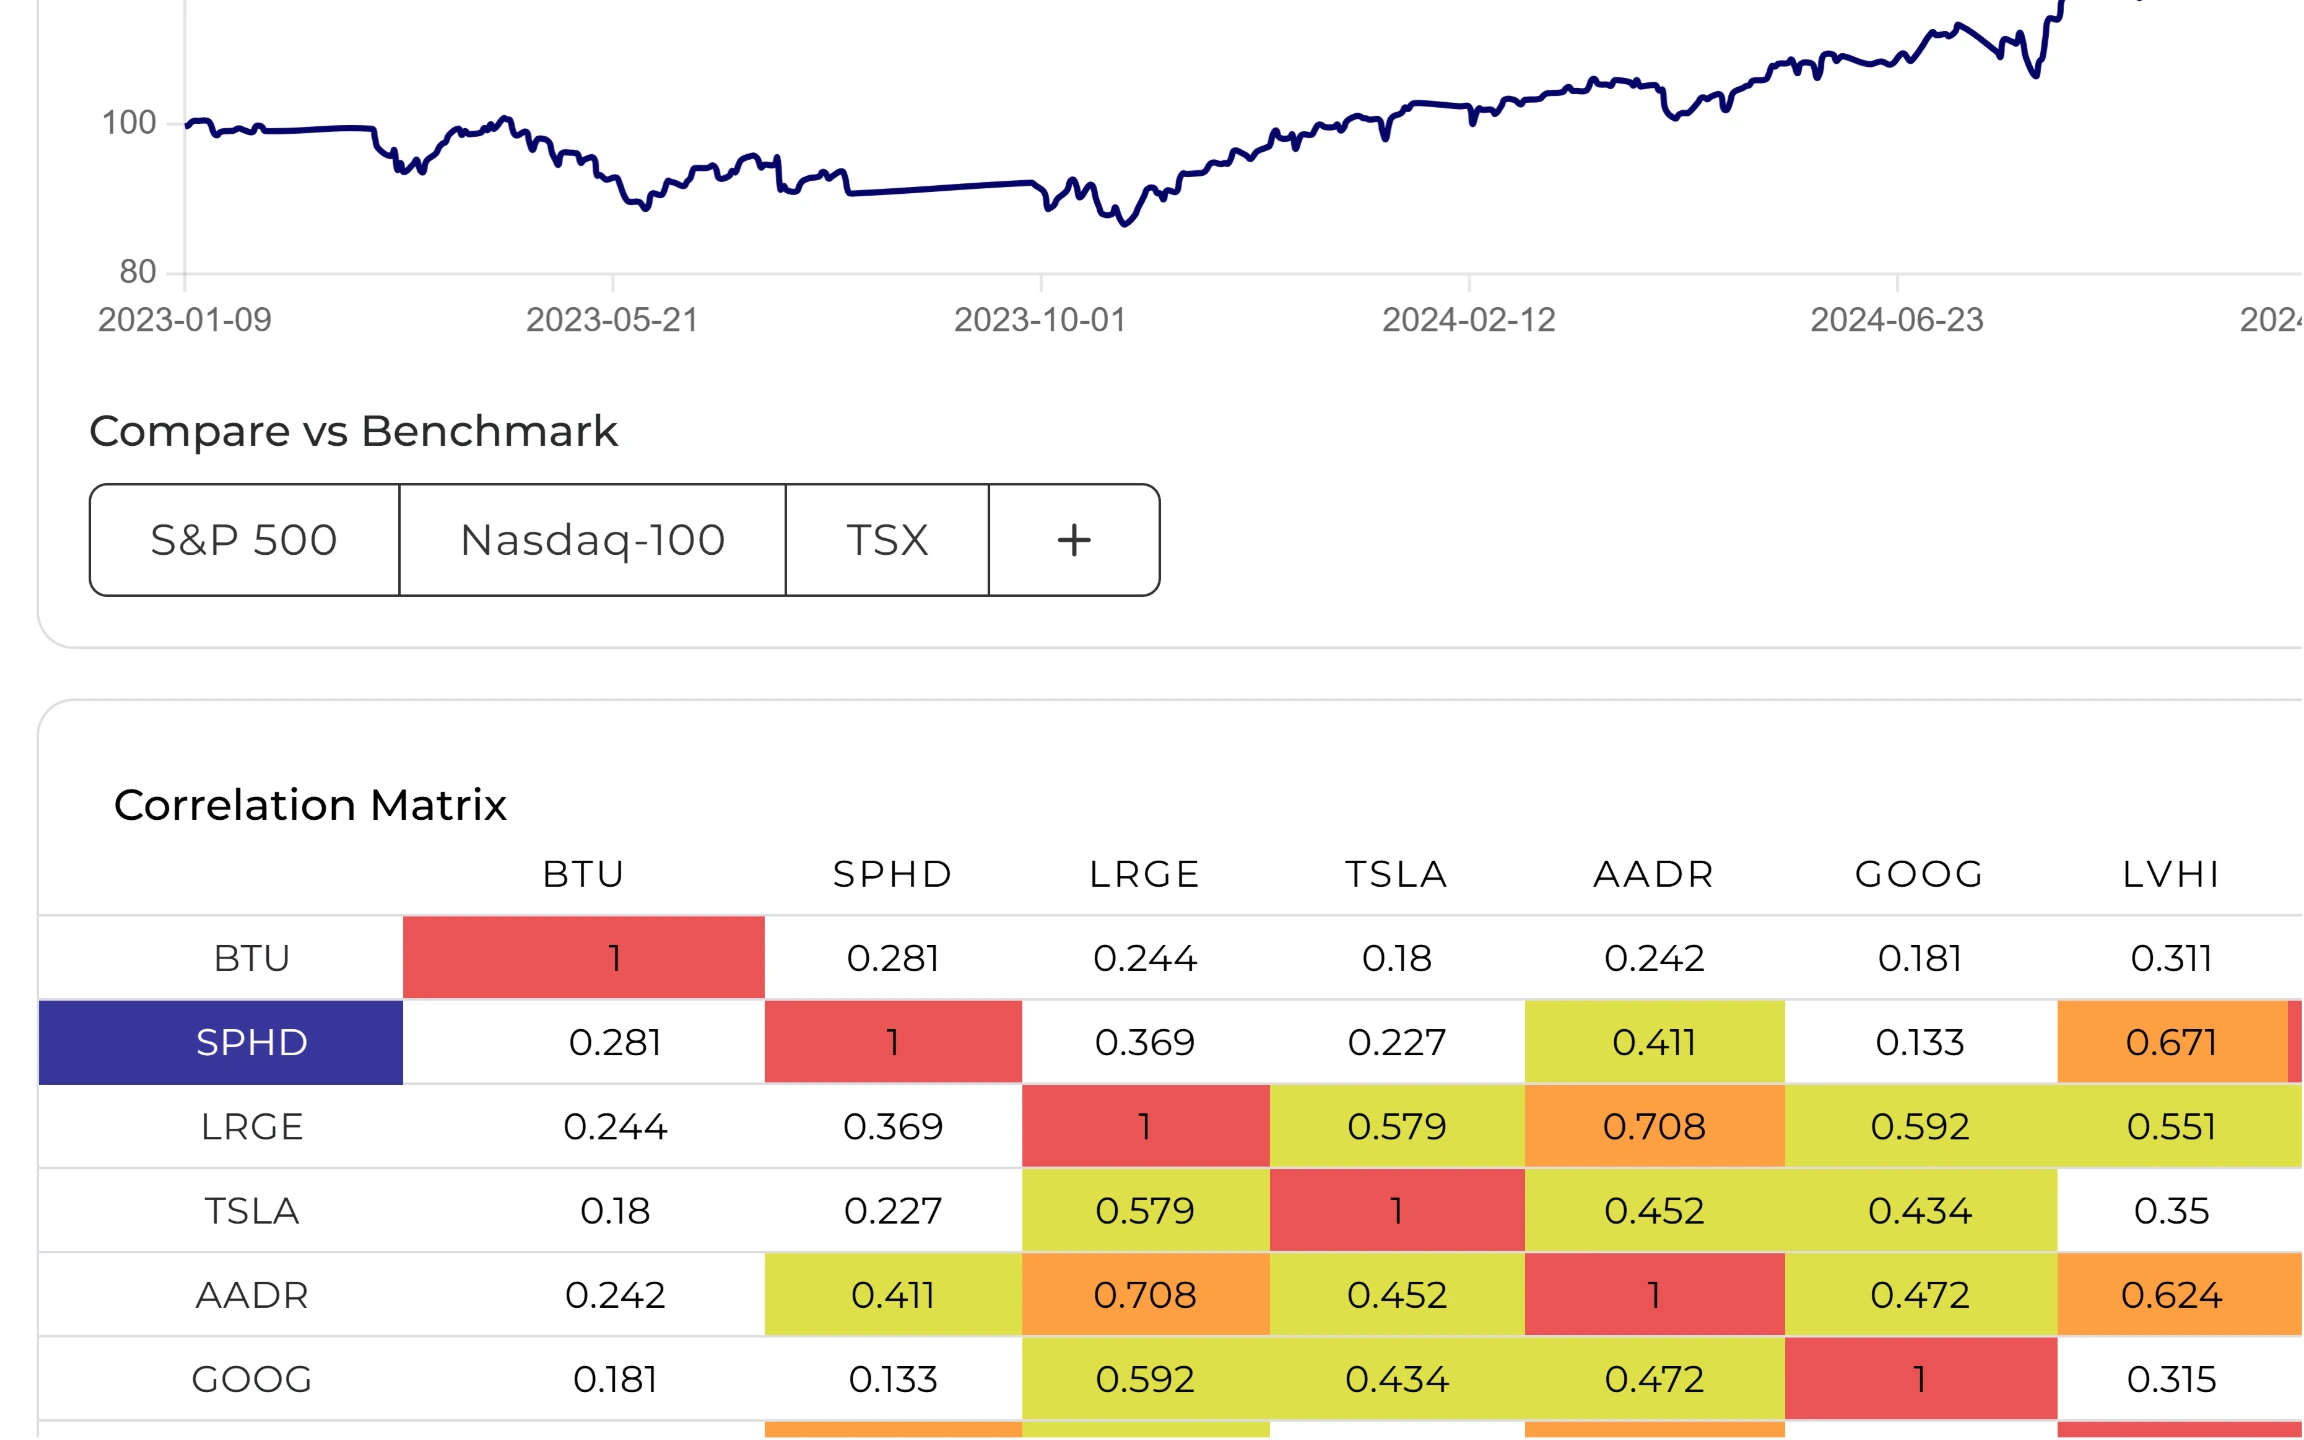
Break down exposure by asset class, sector, geography, and individual securities. See which holdings move together during stress. Run quarterly reviews in half the time.
Get Alerts Before Portfolios Drift Out of Range
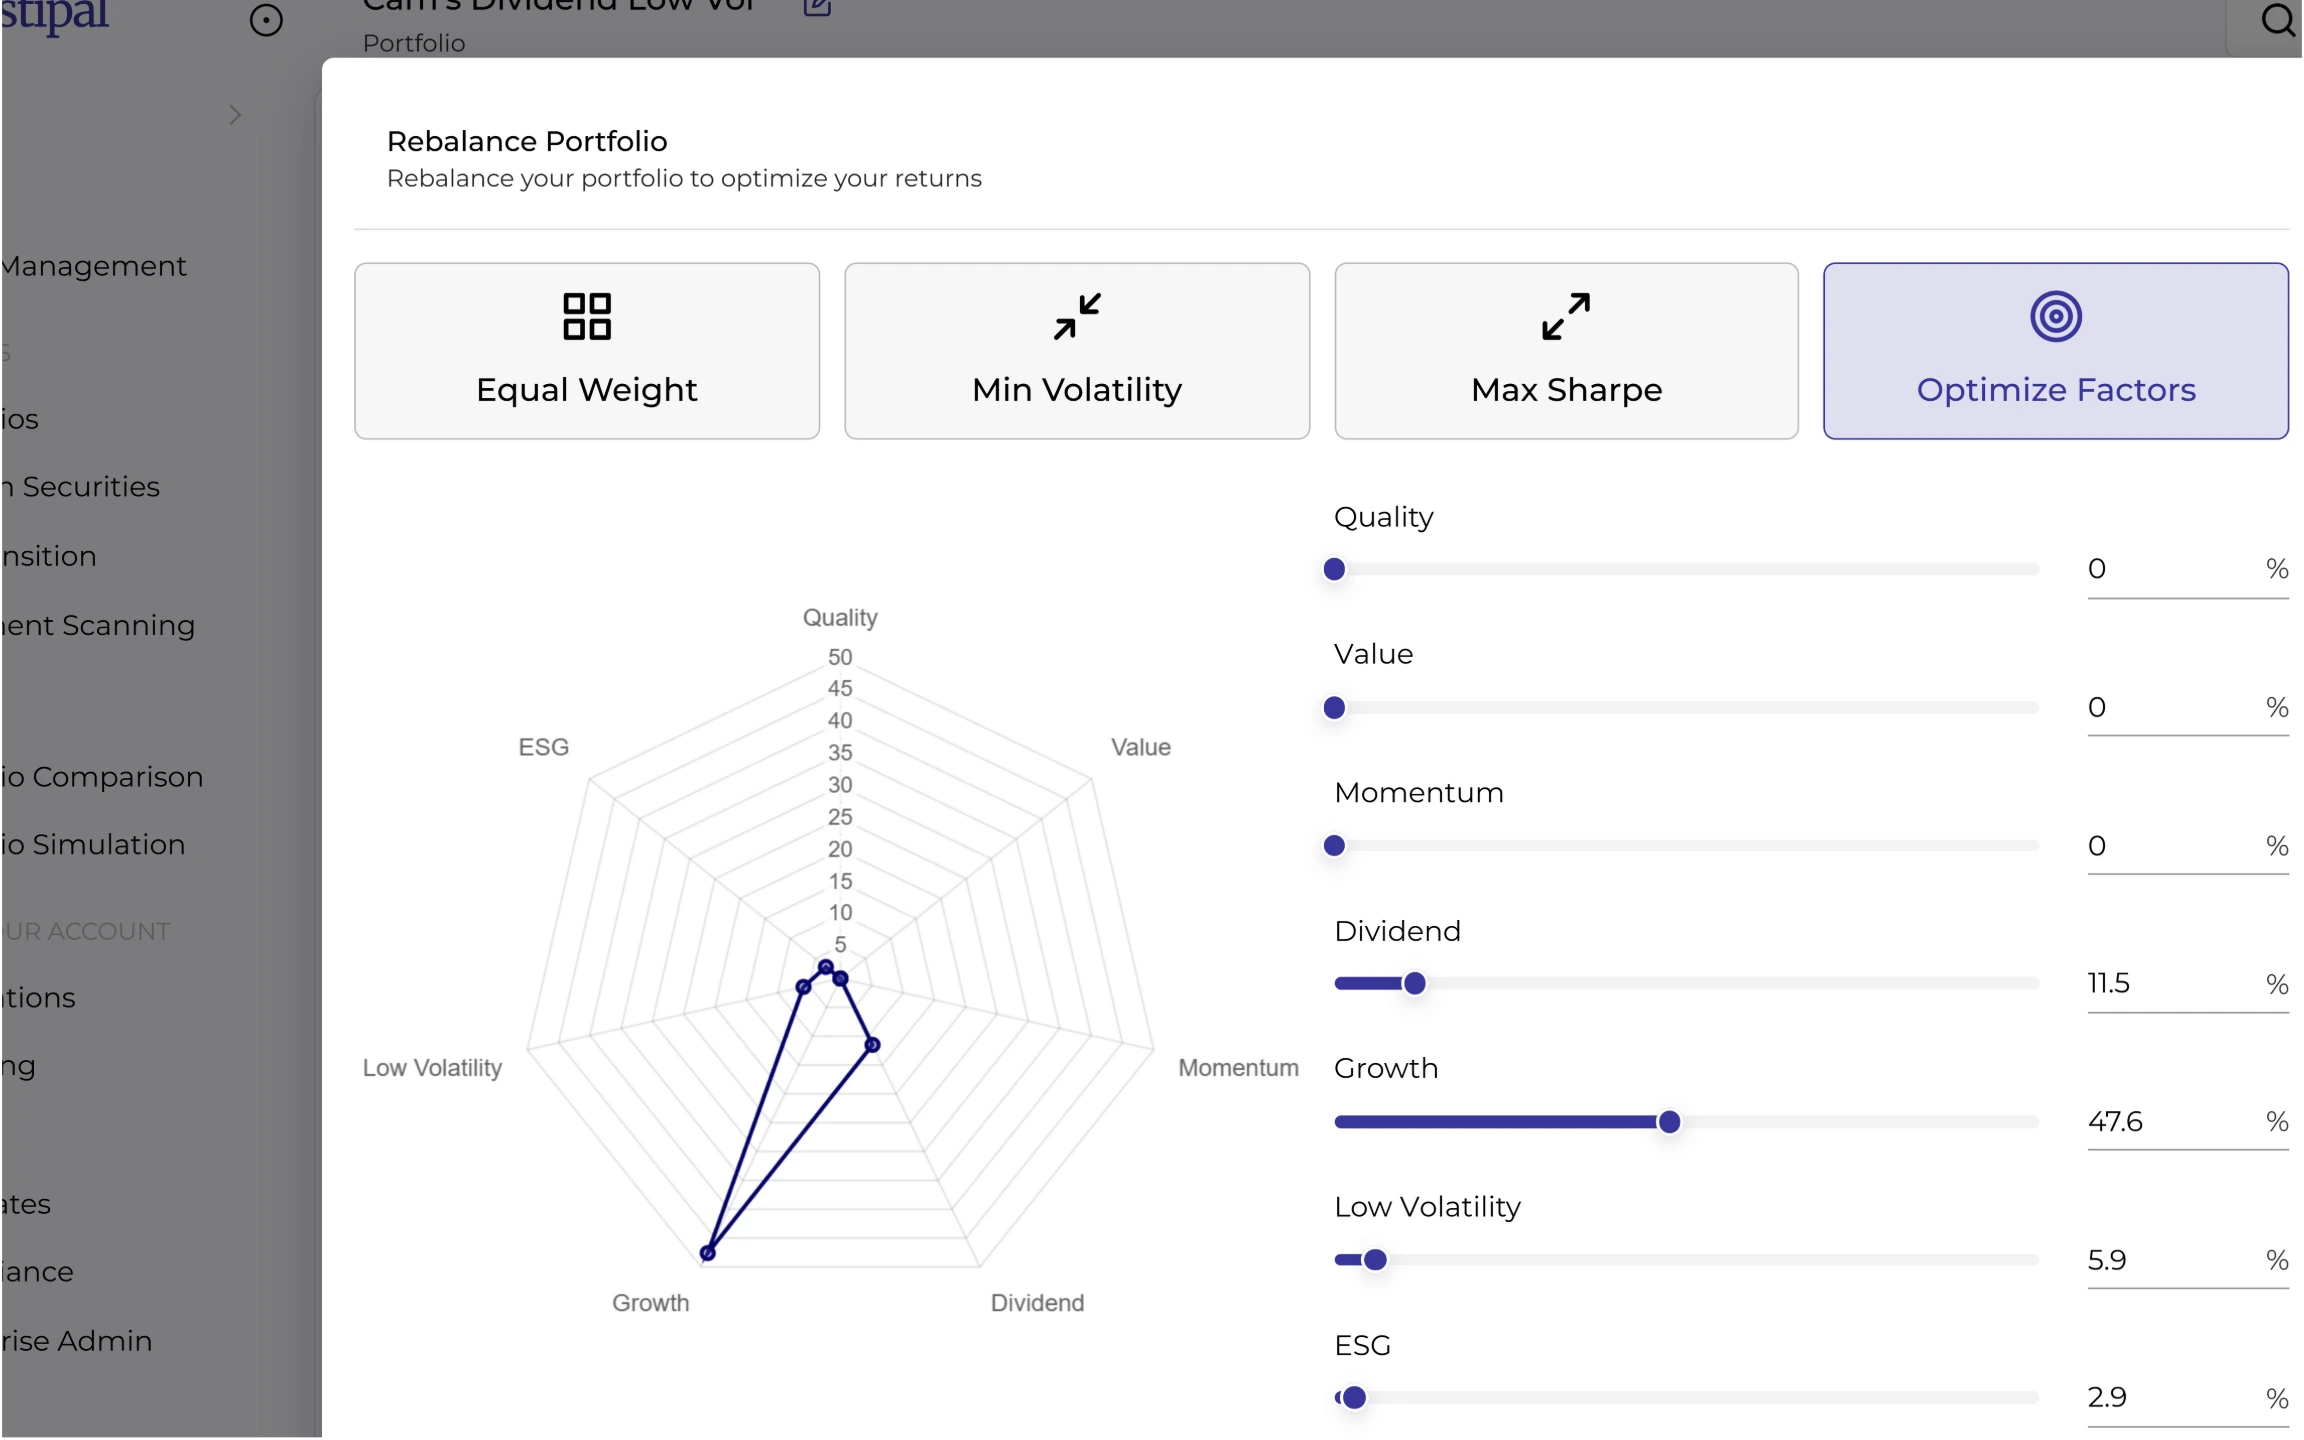
Set thresholds and get notified when portfolios drift. Pick a rebalancing strategy (Min Volatility, Max Sharpe, Factor Optimization) and calculate optimal trades that minimize turnover.
Answer "How Bad Can This Get?" With Data
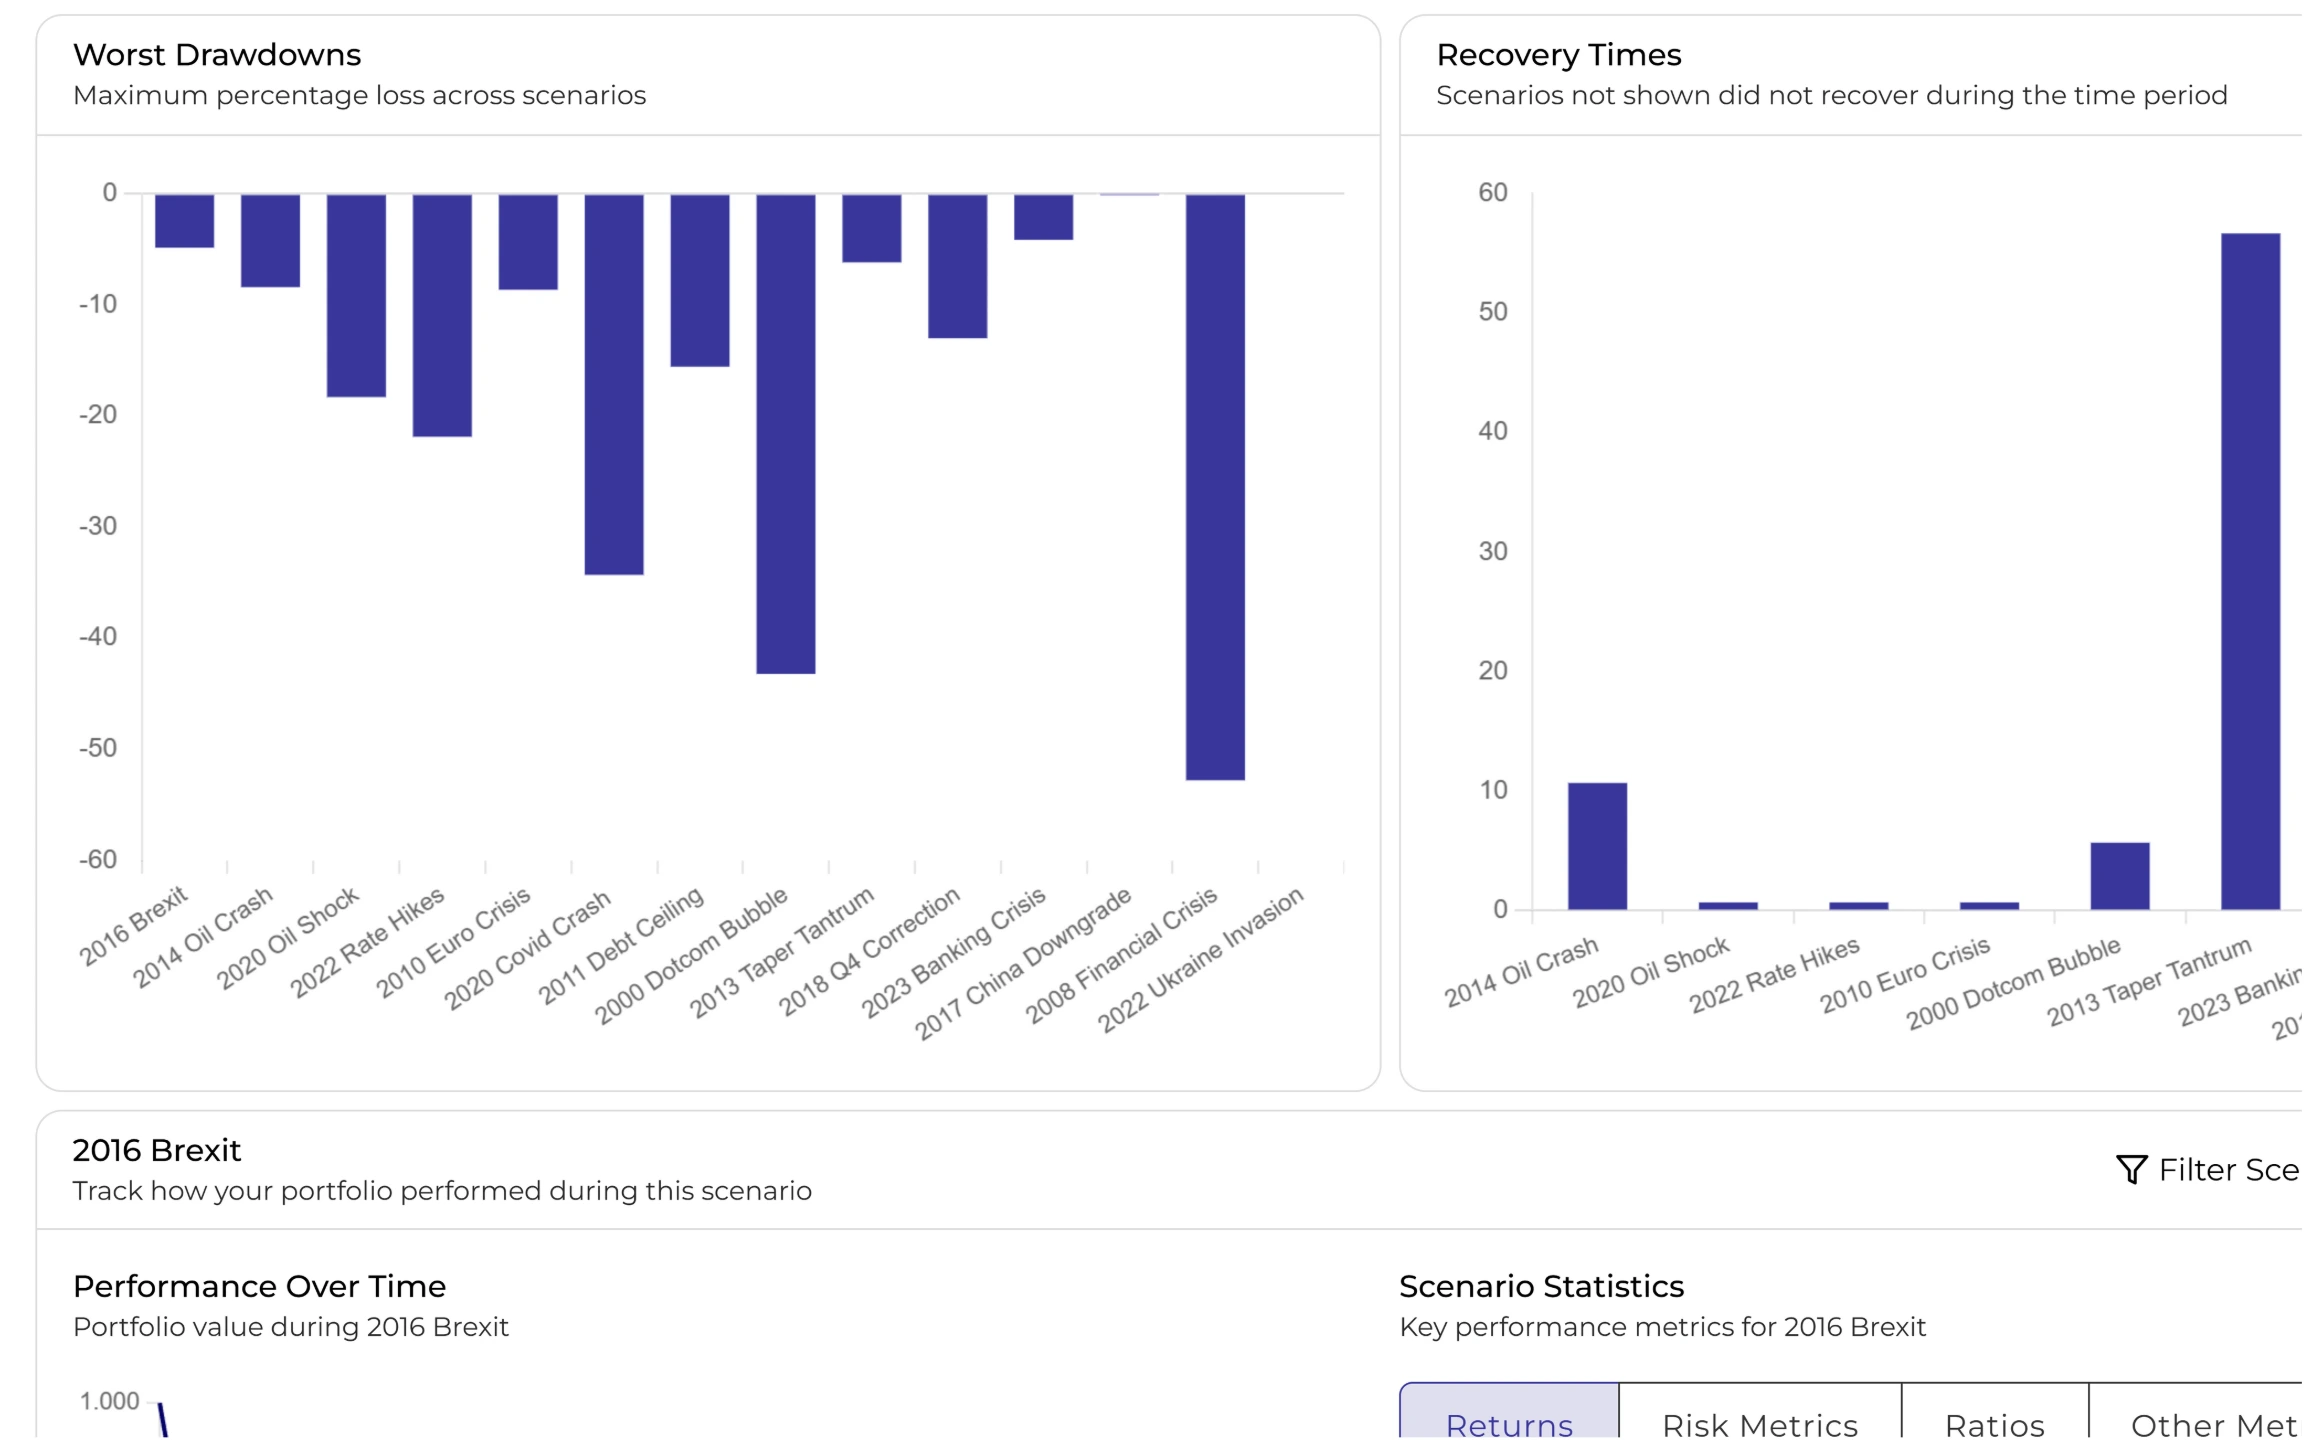
Model how any portfolio would have performed in 2008, COVID 2020, or the 2022 rate shock. Have the scenario analysis ready when markets drop, not guesses.
Trusted by financial advisors
See how practices are transforming their workflows
"We're deeply committed to integrating cutting-edge technology to transform the financial planning landscape. Investipal's innovative approach aligns perfectly with our vision, particularly in utilizing OCR technology to streamline processes and elevate the client and advisor experience."
ProsperPlan Wealth
"Investipal has completely transformed how we approach client onboarding and portfolio management. The AI-powered tools save us countless hours while delivering better outcomes for our clients."
Pacific Portfolio Advisors
"Investipal has been a game-changer for our firm. It really had become an efficiency multiplier for our assistants and back office. It's an indispensable tool for any advisory firm looking to thrive in today's competitive market."
William Joseph Capital Management
Frequently asked questions
Common questions answered
What risk metrics does the portfolio risk management software track?
Investipal tracks concentration by sector, geography, and asset class; correlation analysis between holdings; portfolio drift from target allocations; historical drawdown analysis; and scenario modeling for market events like 2008, COVID, and sector corrections. All metrics update in real-time as portfolio changes are made.
How does concentration analysis work?
Investipal's concentration analysis looks through fund holdings to reveal underlying exposure. If a client owns three "diversified" funds that each hold Apple, Google, and Microsoft, the platform aggregates that exposure to show true tech concentration, not just the surface-level fund allocation. This look-through analysis catches hidden risks that spreadsheet analysis misses.
Does Investipal support stress tests and scenario analysis?
Yes. Investipal models how any portfolio would have performed during historical market events: 2008 financial crisis, COVID crash, dot-com bubble, sector corrections, and more. The scenario analysis shows projected drawdowns and recovery timelines, providing data-backed answers when clients ask "how bad can this get?"
How do portfolio drift alerts work?
Set custom thresholds for each portfolio or use firm-wide defaults. When allocations drift beyond configured thresholds, whether from market movements or deposits/withdrawals, alerts are triggered. Each alert includes recommended rebalancing trades calculated to minimize turnover while returning to target allocation.
What rebalancing strategies does the software support?
Investipal supports multiple rebalancing optimization strategies: Minimum Volatility (reduce overall portfolio risk), Maximum Sharpe Ratio (optimize risk-adjusted returns), Factor Optimization (target specific factor exposures), and Tax-Aware Rebalancing (minimize tax impact). Each strategy generates specific trade recommendations with projected outcomes.
See Portfolio Risk Software in Action
Spot hidden concentration, monitor drift, and run scenario analysis, in one platform.